

CRMFeature

Sales Reports and Employee Activity for Indian Business Owners

Ten reports built from the leads, statuses and reminders your team already records, so the owner sees what is selling and who is following up, without rebuilding an Excel sheet every month.

The short answer

Which sales reports can I see in the CRM?

AliveCRM gives you sales reports and employee activity in one place. There are ten: lead pipeline, conversion funnel, source performance, form performance, sales rep performance, follow-up compliance, project, product catalog, categories and user activity. The lead pipeline report is on every plan, and the other nine are advanced reports on selected paid plans.

In many small businesses in India, the monthly sales review means someone collecting numbers from each executive on WhatsApp and pasting them into a sheet. These reports read straight from the CRM, so the figures are as current as the last status change.

Questions an owner can answer in minutes

  • How many enquiries came in this month, and what are they worth?
  • Which ad, landing page or form brings leads that actually convert?
  • Which sales executive replies fastest, and who keeps missing follow-ups?
  • When did each employee last log in to the CRM?
How It Works

From Daily Work to a Decision

No setup and no formulas: the reports read what the team already records.

  1. 01Leads Worked
  2. 02Statuses Updated
  3. 03Report Filtered
  4. 04Decision Made
Pipeline

Pipeline Value and Conversion Funnel

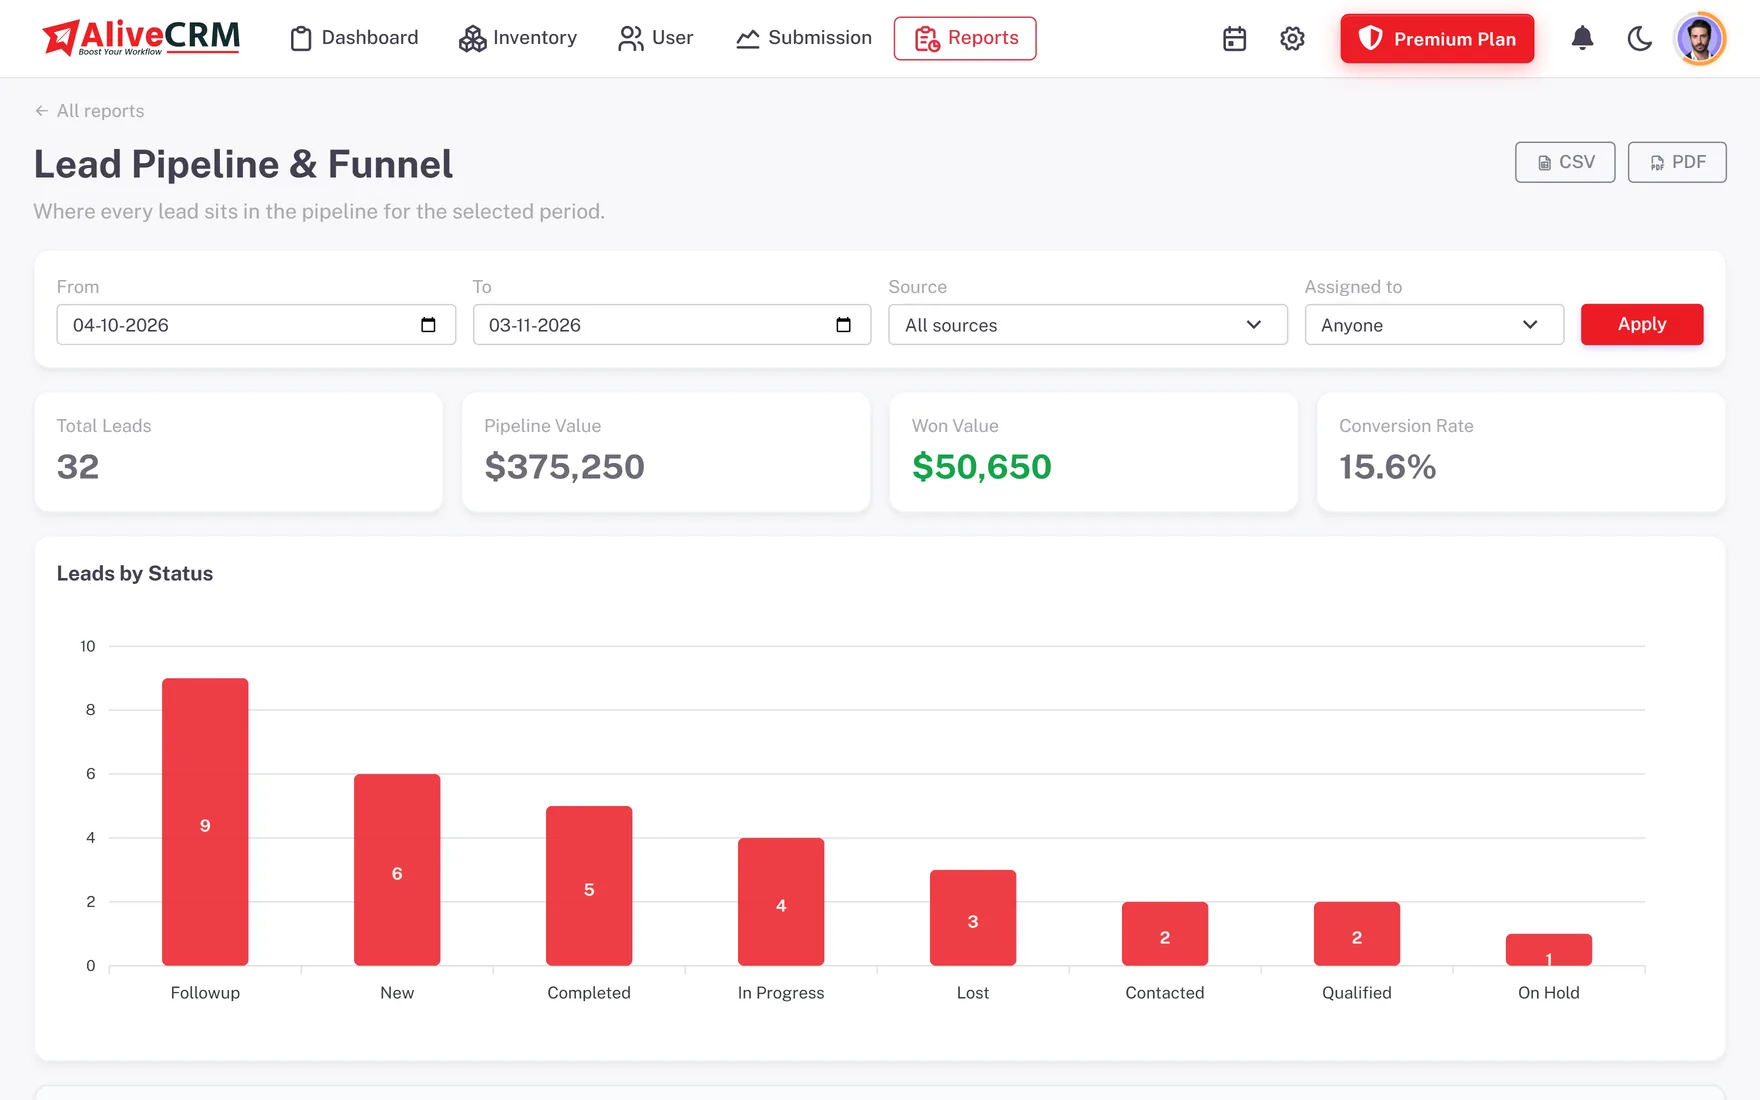
The lead pipeline report shows total leads, pipeline value, won value and conversion rate for the dates you choose, with a count and value for each status. The conversion funnel adds stage-to-stage drop-off, worked out from the real status-change history on each lead. If most leads stall after "Quotation Sent", you know exactly where to look.

  • Pipeline value and won value
  • Count and value per status
  • Funnel from real status changes
See the sales pipeline
Pipeline Value and Conversion Funnel
Channels

Source and Form Performance

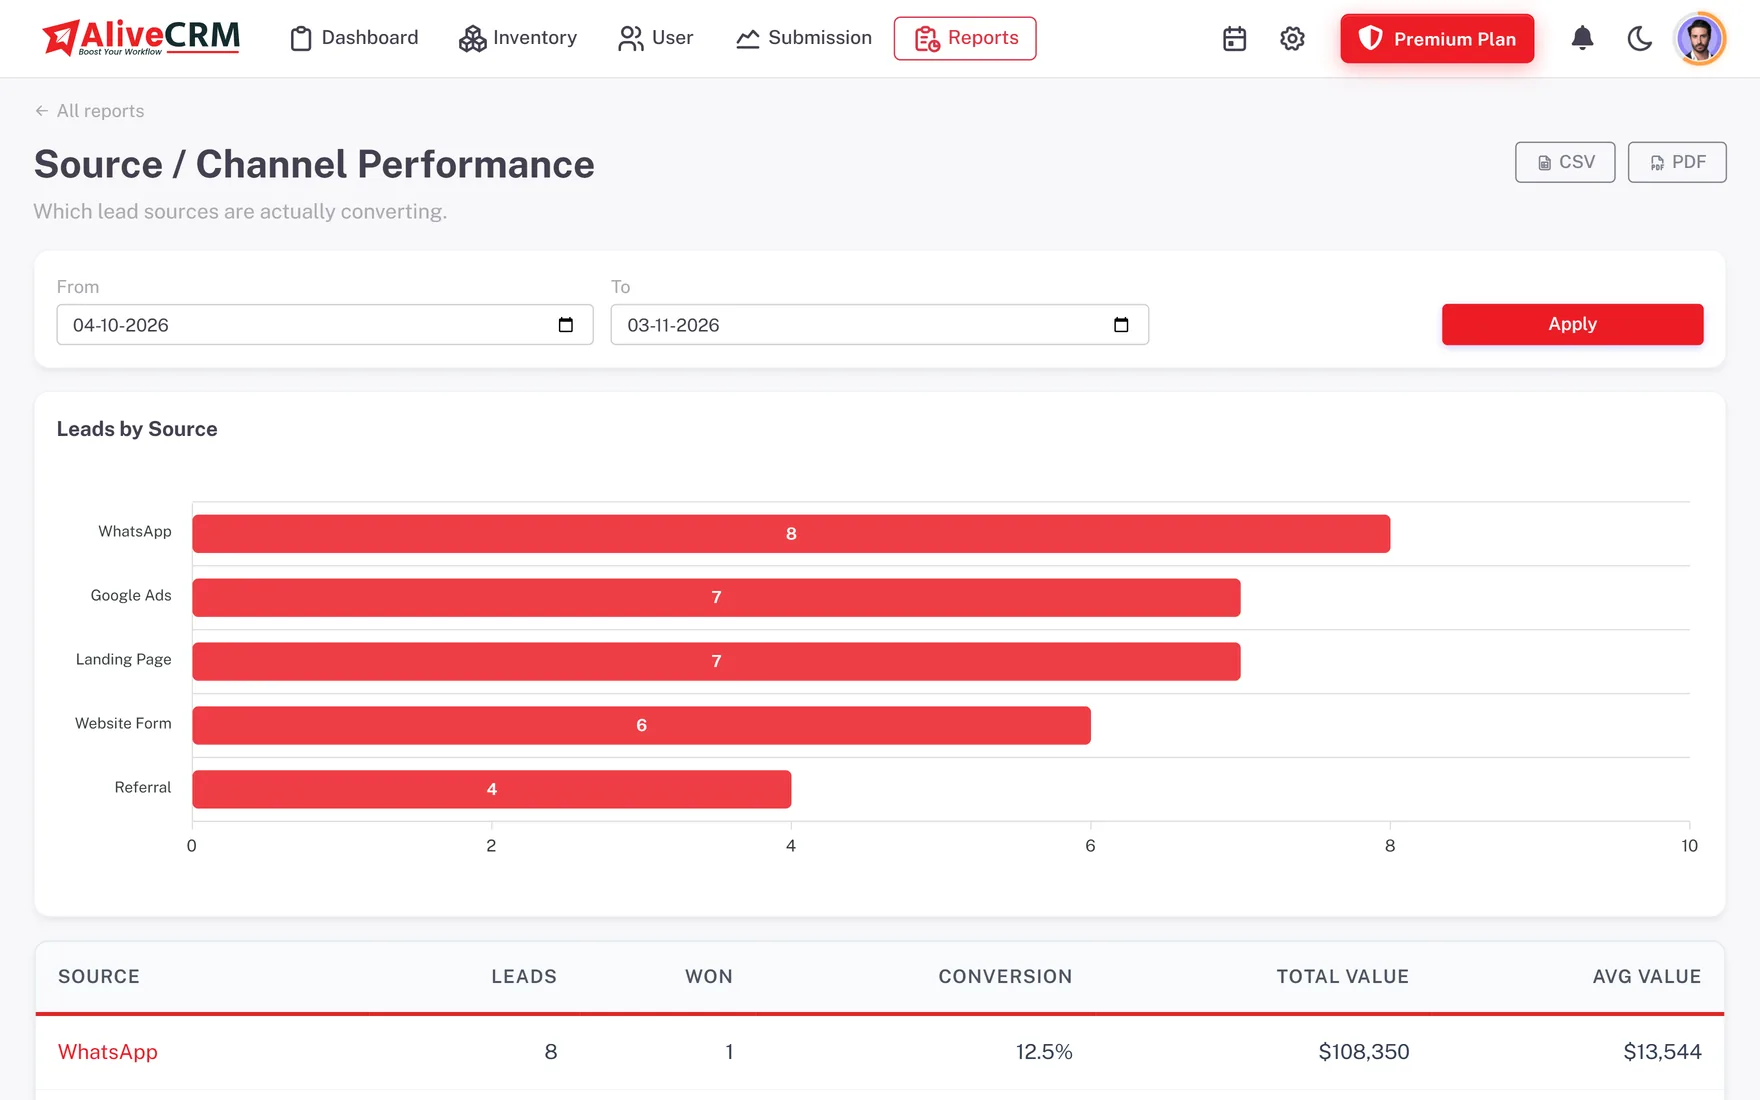
Source performance ranks every channel by lead volume, won count, conversion rate and value, so you can tell a channel that is busy from one that pays. Form performance shows submissions and converted leads for each enquiry form. A coaching institute can compare its course pages, and an agency can see which landing page is worth the ad spend.

  • Leads, won and conversion per source
  • Total and average value per channel
  • Submissions and conversion per form
See lead statuses and sources
Source and Form Performance
Team

Executive Leaderboard and Follow-Up Compliance

The sales rep report ranks each executive on assigned leads, won count, won value, conversion and average response. Follow-up compliance shows how reliably each person clears reminders before they go overdue. Used in a weekly review, it turns "I am calling everyone" into a number, and a slipping habit shows up before it costs you a deal.

See follow-up management software
  • Won value and conversion per executive
  • Average response per person
  • Reminders on time versus overdue
Activity

Employee Activity, Projects and Catalogue

The user activity report shows when each team member last logged in and how many days ago that was, so an owner can spot an executive who has stopped using the CRM. The project report lists each project with its status and lead count. The product catalog report shows orders or bookings per item, and the categories report groups them by category.

See project management
  • Last login per employee
  • Lead count and status per project
  • Orders or bookings per item
Who It Is For

Who Reads These Reports

Owners of small businesses

See pipeline value, won value and which channels pay, without waiting for someone to prepare a sheet.

Sales heads

Use the leaderboard and follow-up compliance in weekly reviews, and coach executives on habits rather than hunches.

Digital marketing agencies

Compare sources and forms on conversion, not just volume, and show clients which campaigns brought real buyers.

Builders and project heads

Check which projects draw enquiries and which towers or phases need more attention from the sales team.

Honest limits

What the Reports Do Not Do

There is no custom report builder, no scheduled email reports and no AI forecasting. Team targets and the leaderboard view live in the mobile app. Reports show what your team recorded, so they are only as reliable as your statuses and sources. Exports are available where your role allows, in CSV or PDF depending on the report, for combining with other data.

FAQ

Frequently Asked Questions

Can I see what each employee is doing in the CRM?

Yes. The sales rep report shows each executive's assigned leads, won count, won value, conversion and average response, and follow-up compliance shows who clears reminders on time. The user activity report shows each person's last login. These advanced reports are on selected paid plans.

Do the reports need any setup?

No. They are built from your leads, statuses, sources and reminders, which AliveCRM records as your team works. Pick a report, set the dates and any filters, and it is ready. The one thing worth doing first is marking which statuses count as won and which count as lost.

Can I export reports to Excel?

You can export to CSV, which opens directly in Excel or Google Sheets. The pipeline, source, sales rep, follow-up and form reports export to CSV and PDF, the project, catalog, categories and user activity reports to CSV, and the conversion funnel to PDF. Exports follow your role's permissions.

Which reports are on which plan?

The lead pipeline report is available on every plan, including the 7-day trial. The other nine, such as source, form and rep performance, follow-up compliance, the conversion funnel and user activity, are advanced reports on selected paid plans. The pricing section shows the current split, with INR pricing.

Can I filter reports by date, source or executive?

Yes. The pipeline, funnel, source, rep, follow-up and form reports take a from and to date, so you can look at a week, a month or a financial quarter, and some add a source or owner filter. The project report filters by status, and the catalog by product or service.

Are lead values shown in rupees?

Yes. Lead values and report totals use your company's currency, which is INR by default, so pipeline value and won value appear in rupees. Values come from what your team enters on each lead, so keep them updated as quotations change.

See What Is Actually Converting

Start a 7-day trial with no card needed. The lead pipeline report works from your first lead, and pricing is in INR.

Book a demo

See forms, leads and follow-ups set up for your team on a live call. Leave your details and we will reach out to pick a time.